scatter plots
A scatter plot is a graph with points plotted to show the relationship between two sets of data.
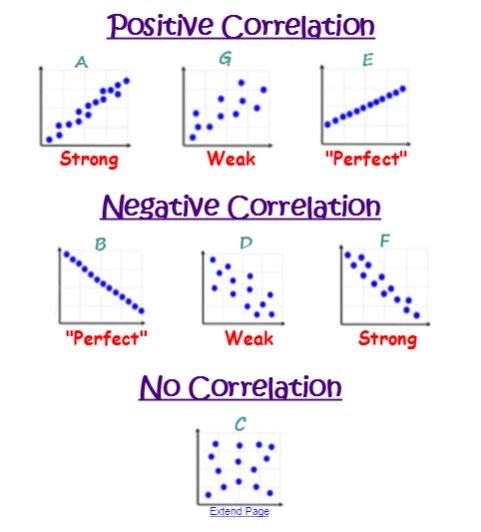
A scatter plot can either have a positive, negative, or no association.
A trend line is a straight line that comes closest to the points on a scatter plot.
A scatter plot can either have a positive, negative, or no association.
A trend line is a straight line that comes closest to the points on a scatter plot.
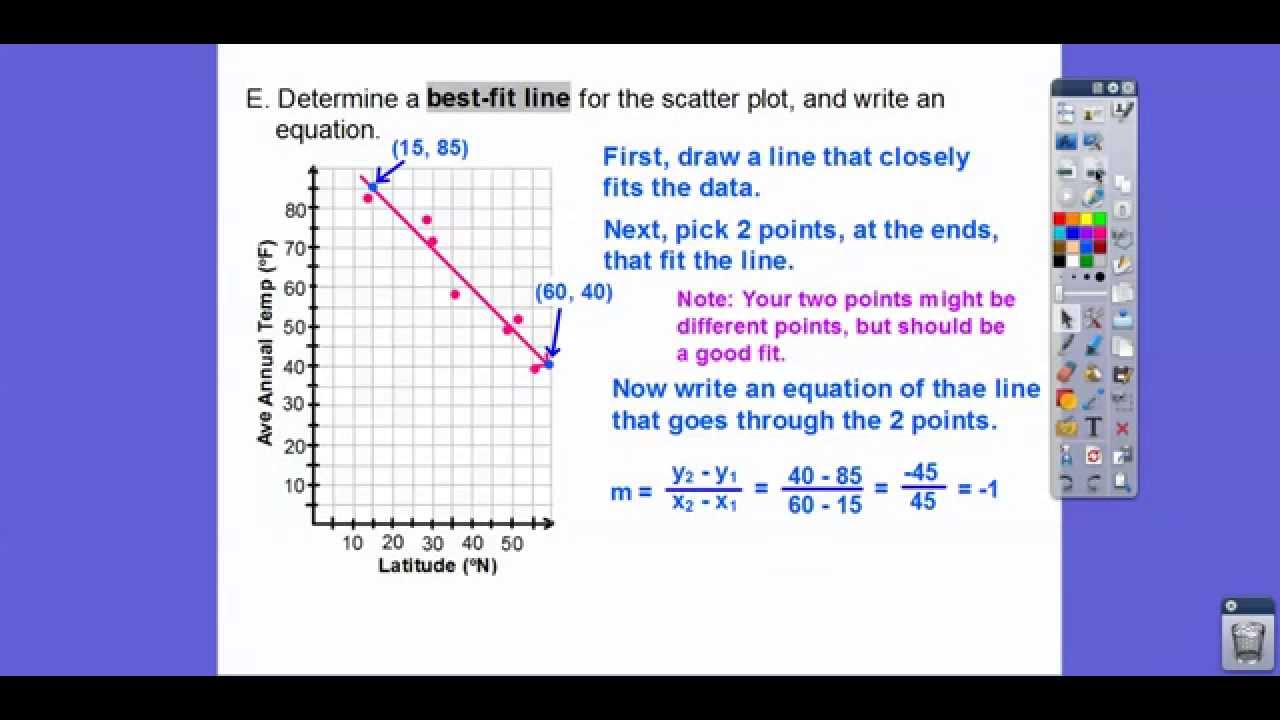
Line of best fit
A line of best fit or trend line helps us to predict values.
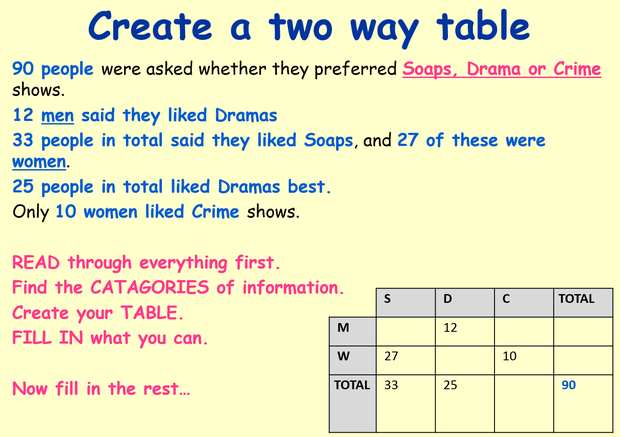
two way tables
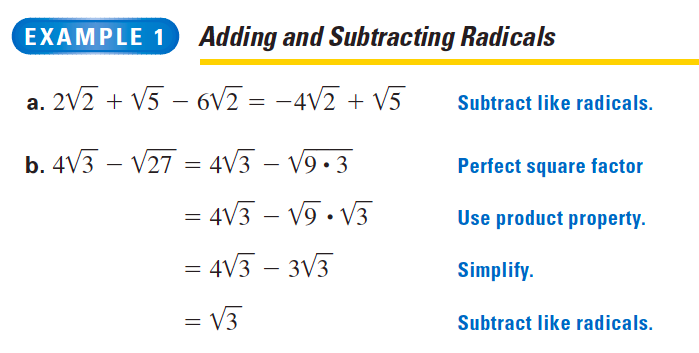
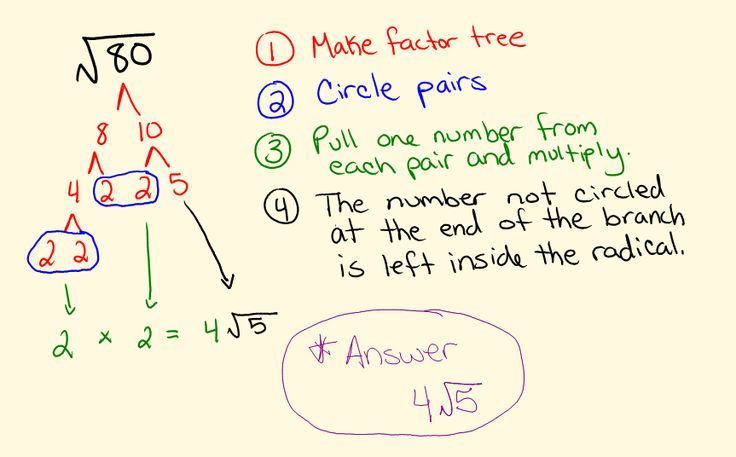
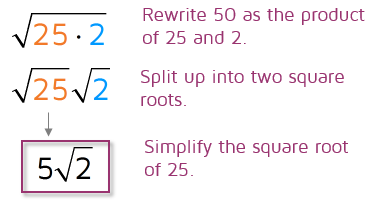
Simplifying radicals
|
|